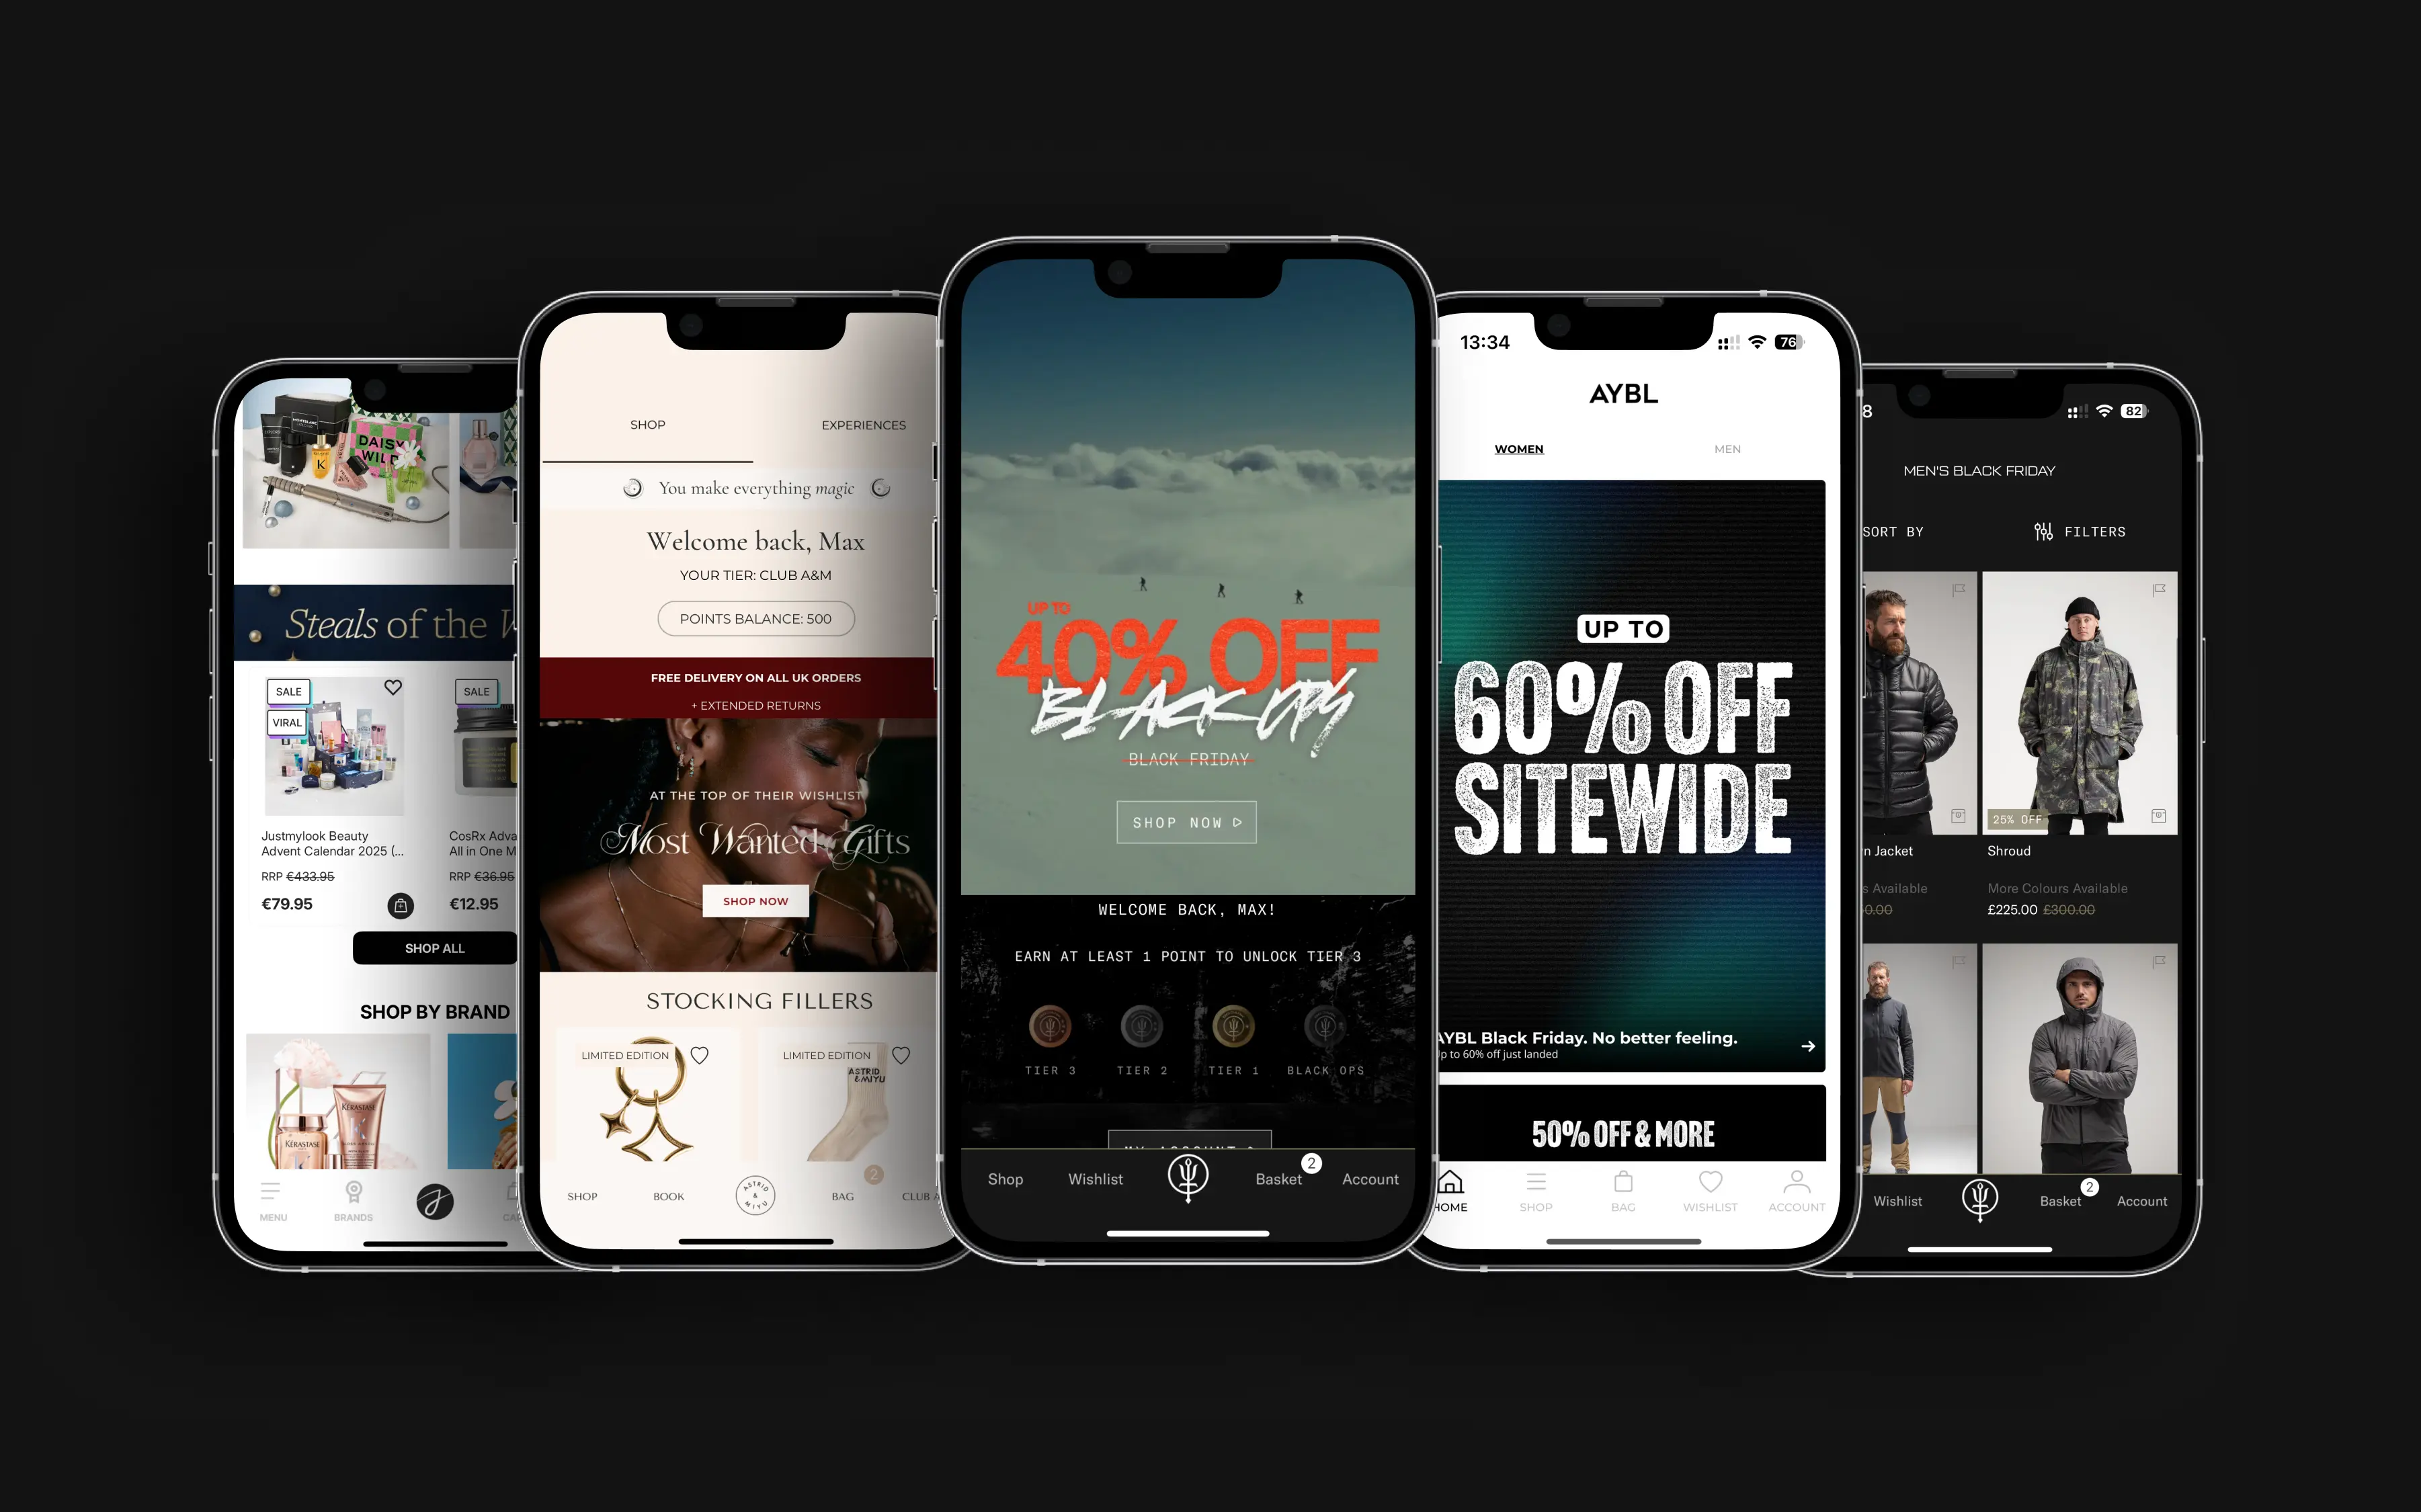
35 Essential Stats on Mobile Commerce in 2025
Mobile commerce (or m-commerce) continues to surge in 2025, reshaping how we shop and sell online. In fact, m-commerce is projected to account for about 59% of all online retail sales worldwide in 2025, roughly $4.0 trillion in volume. With around 1.65 billion people – 30% of internet users – shopping on mobile devices, prioritising the mobile experience is no longer optional. Below we break down the latest statistics and insights across key areas of mobile shopping, from apps vs web usage to conversion rates, speed, and consumer trends.
Author:
Max Hatter
Publish date:
16th May 2025
10 Min Read
Mobile Commerce Sales Trends
It's no surprise that mobile commerce is booming. With an estimated 4.88 billion smartphone users globally, mobile shopping is more accessible than ever. Lets compare mobile commerce sales across the globe.

1) Globally, m-commerce sales are projected to be some where between $2.5 - $6 trillion in 2025, depending on the source.
2) In the US, mobile commerce sales are forecasted to cross $710 billion in 2025 according to estimates, reflecting the robust and accelerating adoption of mobile shopping in the US.
3) Meanwhile in the United Kingdom, m-commerce sales are expected to surpass £100 billion in 2025, once again highlighting the considerable acceleration of mobile shopping demand.
This acceleration is no happy accident, however. Improvements in smartphone technology, mobile web browsing and native shopping apps have all contributed to the boom.
But when looking at consumer preferences, which is the more favoured way to shop? Let's compare mobile web shopping vs buying on a native app.
Mobile App vs Mobile Web: Shopping Habits and Preferences

When analysing which is shoppers preferred way to buy, the data shows that mobile apps have the edge.
4) Over half of all mobile commerce transactions (54%) now happen in shopping apps, versus 46% via mobile browsers. Several performance metrics tilt heavily in apps’ favour:
Mobile App vs Mobile Web Conversion Rates
5) Mobile apps consistently outperform mobile websites in terms of conversion rates. On average, apps deliver conversion rates that are 157% higher than mobile websites.
Several factors contribute to the improved conversion rates but perhaps the most influential is speed of page loading. Thanks to the app being installed on your device, its able to load pages 2-3x more quickly than a mobile website.
Mobile App vs Mobile Web Average Order Value
6) Shoppers view about 4.2× more products per session in apps compared to mobile sites indicating deeper browsing.
This richer engagement translates to bigger baskets.
7) Average order values are around 15% higher on mobile apps
Mobile App vs Mobile Web Cart Abandonment

8) The streamlined UX of apps reduces drop-off. Shopping apps see only about a 20% cart abandonment rate, versus approximately 68% on desktop sites and a whopping 85.65% on mobile web.
In other words, there's significantly more drop off on clunky mobile sites, while apps retain most shoppers through checkout.
Mobile App vs Mobile Web Consumer Preference
9) It’s telling that a vast majority prefer the app experience – only 12% of consumers say shopping on the mobile web is convenient.
Small screens and finicky mobile web design are frequent complaints. Apps (with better layouts, saved info, and native features) simply make mobile shopping easier and faster, which is why they now drive the bulk of mobile commerce.
All these stats underscore that a well-designed shopping app can significantly outperform a mobile website.
Without doubt mobile web is still crucial for reach and offers the convenience of no download required, but investing in a quality app experience can pay off in higher conversion and a smoother shopping experience.
Additionally, mobile apps give you the power to send Push Notifications, which can be incredibly effective at driving repeat purchases and revenue. We've analysed the effectiveness of push notifications in mobile commerce by looking at some key data below.
Push Notifications: Adoption and Effectiveness in Mobile Commerce
With the rise of mobile commerce and shopping apps has come push notifications. Push notifications are real-time alerts sent to your mobile device from mobile apps. Almost everyone with a smartphone would've received one at some stage with the average US smartphone user gets 46 push notifications every day.
Love them or loathe them, their effectiveness for driving mobile commerce sales cannot be denied. Let's take a peek at some of the data.
Push Notification Opt-in Rate in Mobile Commerce

10) Push notification opt-in rate for retails app is around 75% on iOS and 55% on Android.
Why does this matter? Data shows push notifications are highly effective at re-engaging users and driving purchases:
Push Notification Effects on Retention in Mobile Commerce
Apps that send notifications see far better user retention. One large study found retention rates nearly 3× higher when users received at least one push in their first 90 days, compared to users who got no pushes.
11) For retail apps specifically, sending regular pushes can multiply retention – weekly notifications led to 2–5× higher 90-day retention, and daily notifications resulted in 3–6× higher retention.
User Tolerance of Mobile Commerce Push Notifications
When it comes to user tolerance of push notifications, retail and mobile commerce apps are third only to social media and news platforms.
12) 26% of mobile commerce app users actively seek out push notifications and want to be informed of the latest releases, products & order status.
Done right, push notifications create a sense of personal connection and urgency that brings shoppers back into your app. Retail brands in 2025 are increasingly leveraging this channel for flash sales, back-in-stock alerts, abandoned cart reminders and more – all to great effect, as the statistics above show.
The key is finding the frequency and content sweet spot that maximises engagement without turning users off.
Mobile Commerce Conversion Rates
Despite the massive shift to mobile shopping, converting mobile browsers into buyers remains a challenge. Traditional desktops still have a slight edge in conversion efficiency.
This gap is often attributed to mobile usability issues (small screens, harder input) and user habit of researching on mobile but checking out on desktop. However, the gap has been narrowing and is expected to continue closing as mobile experiences improve.
Several data points highlight the state of mobile conversion in 2025:
Mobile vs Desktop Commerce Conversion
13) Around 3% of desktop website visits result in a purchase, compared to roughly 2% of mobile visits.
Mobile conversion has improved over the years but still lags slightly. Many consumers start their product searches on mobile and finish the purchase later on a larger device, which contributes to the lower last-click conversion on phones.
Mobile vs Desktop Average Order Value
14) Desktop orders average about $40 more in value than mobile orders. In dollar terms, people spend roughly $155 on an average desktop checkout vs $112 on mobile
In summary, while mobile commerce accounts for the majority of traffic and an ever-growing share of sales, its conversion rate still slightly trails desktop. Brands should focus on removing remaining friction points in the mobile checkout process and building native mobile apps to unlock greater conversion rates.
Mobile vs Desktop Shopping Behaviour
Mobile devices have firmly taken the lead in online shopping activity, but consumer behaviour on mobile vs desktop can differ in important ways. Let’s compare how the two channels stack up in 2025:
Mobile vs Desktop: Share of traffic and sales
15) Globally, mobile is now the dominant e-commerce channel. As of 2025, about 59% of all online retail sales worldwide come from mobile devices, overtaking desktop.
16) Even in the US – a traditionally desktop-heavy market – mobile commerce is expected to make up 44% of e-commerce sales by 2025 (up from ~42% in 2022).
In terms of browsing, the disparity is even larger.
17) An estimated 78% of retail website traffic now comes from smartphones/tablets, versus just 22% from desktops, with those mobile visits accounting for around 66% of orders.
This indicates desktop visitors still convert at a somewhat higher rate (as discussed above), but mobile is quickly catching up and already delivers the bulk of both clicks and purchases.
Mobile Commerce Adoption and Usage
The majority of consumers today are mobile shoppers.
18) In the United States, roughly 76% of adults (about 200 million people) have made a purchase on a smartphone.
19) Globally, the count of mobile shoppers stands at 1.6+ billion.
Mobile Transactions vs Browsing
Consumers often use mobile devices as a shopping companion even if the final purchase happens elsewhere.
20) Surveys show almost half of mobile users (49%) use their phones to compare product price.
21) 40% use mobile devices to redeem digital coupons and 30% use them to look up product information when they’re interested in an item
This happens both in-store (e.g. checking reviews or finding alternatives while standing in a shop) and during online browsing. Mobile essentially puts a product research tool in every shopper’s pocket. Retailers need to ensure their mobile sites/apps provide ample product info, reviews, and easy price transparency to serve this use-case.
It’s common for a single shopping journey to span devices – for instance, discovery on mobile, checkout on desktop.
22) One Facebook IQ study noted 46% of shoppers prefer researching product ratings/reviews on mobile, but many then switch to a PC to complete the purchase
Consumers mix and match devices in whatever way is most convenient. This means businesses must create a experience across mobile and desktop, including saved carts, wish lists, and consistent pricing, to accommodate cross-device shoppers.
Speed Matters: The Impact of Mobile Page Load Times
If there’s one thing that can still derail a mobile shopping experience, it’s a slow or poorly performing site. Mobile users have high expectations for speed, and the data shows performance directly impacts engagement and conversion:
User Expectations
23) About 83% of people expect mobile websites to load in 3 seconds or less.
Patience is thin – if a site lags, users will bail out quickly.
24) 73% of consumers say they’ll switch to an alternative site or app if a mobile page is too slow. In other words, a slow site not only loses that visit, it can drive shoppers straight to a competitor.
Bounce and Abandonment Rates
The longer your page takes to load, the more visitors you lose.
25) If a mobile page exceeds 4 seconds load time, around 63% of users will abandon it
26) By 6 seconds, about two-thirds of visitors have bounced away This drop-off is stark – attention on mobile is a fleeting resource.
27) Nearly half of shoppers won’t even wait to see if a slow page eventually works; 45% are less likely to make a purchase if a site loads slowly and many will just exit or not return.
The message is clear: every second (or even every fraction of a second) counts.
Conversion Uplift with Speed
Improving mobile site speed can yield major gains in conversion metrics.
28) Google’s research found that a mere 0.1-second improvement in mobile page load time boosted retail conversion rates by 8.4% on average
29) Similarly, that tiny speed-up led to 9.1% more shoppers adding items to their carts during sessions.
These are huge impacts for such a small performance tweak.
Engagement and Dwell Time
Speed affects not just whether users buy, but how much they explore. On fast sites, people browse significantly more.
30) At a snappy 2-second load time, mobile shoppers view about 8.9 pages per session on average, but when load times slow to 8 seconds, they only view around 3.3 pages.
Faster loading keeps users engaged and clicking through more products, which increases the chances of conversion.
Other Notable Mobile Commerce Trends
Beyond the core areas above, a few other trends are shaping mobile commerce in 2025:
Digital wallets and frictionless payments
Mobile shoppers are embracing digital wallet payments (Apple Pay, Google Pay, etc.) for speed and security.
31) Almost *9% of online transaction value worldwide is now processed via digital or mobile wallet, making it the most popular payment method online. By 2026, that share is projected to exceed 54%.
Customers appreciate not having to enter card details for every purchase – one-tap payments on mobile are becoming the norm.
Social Commerce Impact
Social media platforms have become shopping hubs in their own right.
32) About 55% of online shoppers have purchased directly through a social media app or site (e.g. Instagram Checkout, Facebook Shops)
Emerging Tech In Mobile Shopping
Retailers are experimenting with new tech to enhance the mobile experience.
33) For instance, 61% of consumers prefer retailers that offer augmented reality (AR) features (such as virtual try-ons) in their mobile shopping experience.
Features like AR and visual search make shopping more interactive on phones. Similarly, innovations like voice commerce and chatbots are gaining traction, though still in early stages.
Demographics and Behaviour Shifts
The mobile commerce boom is led by younger generations
34) The 25–34 age group is currently the most active mobile shopping demographic, followed closely by shoppers in their mid-30s to 40】
That said, all age groups are using mobile to some extent. And it’s not just online-only shopping:
35) 74% of U.S. consumers use their mobile phones for product research even when shopping in physical stores.
Summing Up
We’re all increasingly “mobile-first” in our approach to shopping, wherever it happens. With billions of people on smartphones and new features and apps emerging constantly, m-commerce is set to reach new heights. For businesses, the takeaway is clear: make mobile a top priority. From having a fast, user-friendly mobile site to offering a dedicated app with push notifications, meeting customers on their mobile devices is essential.
If you’re an eCommerce brand on Shopify and a look to build your own mobile app, get in touch with Venn Apps today!
Sources
SellersCommerce.com → 1, 2, 3, 15, 18, 19
MobiLoud.com → 4, 5, 6, 7, 8, 9, 11, 12
Business of Apps → 10
Tidio.com → 13, 14, 16, 20, 21
SimiCart.com → 17
Facebook IQ (Meta for Business) → 22
Queue-it.com → 23, 24, 25, 26, 27, 28, 29, 30
Statista → 31, 33, 34, 35
related blogs
BFCM In Review: Venn Apps Drive $56m in Revenue
5 min read
author:
Max Hatter
publish date:
12th December 2025
Industry Insights
7 Tips to Win Black Friday Cyber Monday (BFCM) with Mobile Apps
10 min read
author:
Max Hatter
publish date:
11th November 2025
Strategy Spotlight
BFCM In Review: Venn Apps Drive $56m in Revenue
5 min read
author:
Max Hatter
publish date:
12th December 2025
Industry Insights
7 Tips to Win Black Friday Cyber Monday (BFCM) with Mobile Apps
10 min read
author:
Max Hatter
publish date:
11th November 2025
Strategy Spotlight
33 Customer Retention Statistics Every eCommerce Brand Should Know (2025)
10 min read
author:
Max Hatter
publish date:
11th November 2025
Industry Insights

9 Strategies to Increase Customer Lifetime Value (CLV) in eCommerce
15 min read
author:
Josh Gare
publish date:
11th April 2025
Strategy Spotlight

12 Best eCommerce Mobile App Development Companies
10 min read
author:
Max Hatter
publish date:
11th November 2025
App Development

Going Omnichannel: How Leading Shopify Brands Are Bridging Online and In-Store with Mobile Apps
10 min read
author:
Max Hatter
publish date:
28th October 2025
Industry Insights

Must-Know Mobile App Download and Usage Statistics in 2025
10 min read
author:
Max Hatter
publish date:
10th October 2025
Industry Insights
Introducing Geo-Located Push Notifications
5 min read
author:
Max Hatter
publish date:
7th October 2025
Product News

Product Updates H1 '25: More Control, Better Insights, Greater Flexibility
10 min read
author:
Max Hatter
publish date:
24th July 2025
Product News
.png)
8 Best Shopify Mobile App Builders in 2025
10 min read
author:
Josh Gare
publish date:
7th February 2025
App Development
.png)
Push Notifications vs Email: Which Drives More Engagement?
10 min read
author:
Max Hatter
publish date:
20th June 2025
Digital Marketing

Shopify Mobile App Development Services: Best Options for 2025
10 min read
author:
Max Hatter
publish date:
5th June 2025
App Development

How To Build An eCommerce App: Complete Guide (2025)
15 Min Read
author:
Max Hatter
publish date:
30th May 2025
App Development

35 Essential Stats on Mobile Commerce in 2025
10 Min Read
author:
Max Hatter
publish date:
16th May 2025
Industry Insights

9 Best ECommerce Mobile App Builders (2025)
10 min read
author:
Max Hatter
publish date:
5th September 2025
App Development
How to Optimize Your Shopify Store for Mobile: The Ultimate Guide
10 min read
author:
Josh Gare
publish date:
16th April 2025
Industry Insights

Guide to Push Notifications for a Shopify Mobile App
5 min read
author:
Josh Gare
publish date:
28th March 2025
Digital Marketing

12 Best Shopify Apps for Clothing & Fashion Stores (2025)
10 Min Read
author:
Josh Gare
publish date:
19th March 2025
Industry Insights

How to turn your Shopify Store into a Native Mobile App (2025)
10 min read
author:
Josh Gare
publish date:
17th March 2025
App Development

9 Essential E-Commerce Growth Strategies for 2025
15 min read
author:
Josh Gare
publish date:
14th March 2025
Industry Insights

Should Shopify Brands Develop Mobile Apps In-House?
15 min read
author:
Josh Gare
publish date:
7th March 2025
App Development

8 Successful Shopify Brands with a Mobile App
10 min read
author:
Josh Gare
publish date:
28th February 2025
Industry Insights
.png)
The Ultimate Guide to Push Notifications for E-Commerce
10 min read
author:
Josh Gare
publish date:
14th February 2025
Digital Marketing
.png)
Shopify Summer Editions: 5 Things We’re Most Excited About
10 Min Read
author:
Max Hatter
publish date:
2nd June 2025
Industry Insights

The 5 Best Tapcart Alternatives To Build A Shopify Mobile App
10 min read
author:
Max Hatter
publish date:
1st July 2025
App Development
.webp)
10 tips to increase app downloads and user activity for Shopify merchants
5 min read
author:
Josh Gare
publish date:
18th November 2024
Digital Marketing

Delivering Omnichannel Loyalty with Mobile Wallet Passes
10 min read
author:
Max Hatter
publish date:
6th May 2025
Product News

WANT TO LEARN MORE ABOUT MOBILE APPS?

